Best TradingView Indicators for Scalping
On this page
Disclosure: ChartSetupLab earns a commission if you buy a TradingView plan through links on this page, at no extra cost to you. This is education, not financial advice. Scalping is high-risk, and no indicator makes it profitable on its own.
Short answer: For scalping on 1- to 5-minute charts, the built-in indicators traders rely on most are VWAP, a fast and a slow EMA, RSI, ATR and volume profile. On the free plan you can run two at a time, so pick a pair that covers trend and timing, for example VWAP plus RSI.
Every indicator below ships with TradingView; you do not need to buy anything or trust a stranger's script.
The shortlist
| Indicator | What it tells a scalper | Typical settings | Free plan? |
|---|---|---|---|
| VWAP | Where the average participant is positioned today; above it buyers are in control, below it sellers | Session anchor (default) | Yes |
| EMA 9 and EMA 21 | Short-term trend and pullback zones | 9 and 21 on 1m–5m | Yes (counts as 2 if added separately) |
| RSI | Momentum and stretched moves | Length 7–14 | Yes |
| ATR | How far price typically moves per bar; used to size stops | Length 14 | Yes |
| Bollinger Bands | Volatility squeeze and expansion | 20, 2 | Yes |
| Volume profile | Price levels where most volume traded | Visible range or session | Paid plans |
How each one is used
VWAP: the intraday anchor
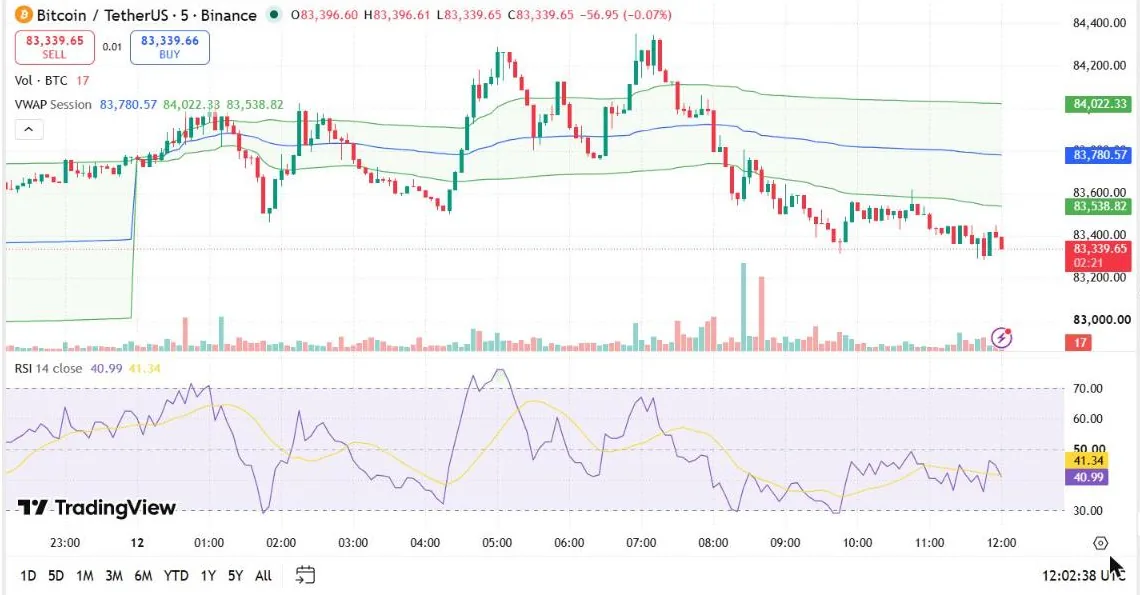
VWAP resets each session, which makes it a natural reference for intraday traders. Many scalpers only look for long trades while price is above VWAP and short trades below it, and treat a return to VWAP as a pullback entry zone. It is most useful on markets with clear sessions, such as stocks and index futures; on 24-hour crypto markets, check which session anchor your chart uses.
EMA 9 and 21: trend and pullbacks
When the 9 is above the 21 and both slope up, the short-term trend is up. Pullbacks into the space between them are where trend-following scalpers look for entries. When the two lines tangle flat, the market is choppy, which is often a signal to stand aside rather than trade.
RSI: timing, not direction
On fast charts, RSI is better at telling you a move is stretched than telling you it will reverse. A common use: in an uptrend (price above VWAP, 9 above 21), wait for RSI to dip toward the lower part of its range and turn back up before entering.
ATR: sizing stops honestly
ATR shows the average range of recent bars. A stop tighter than one ATR is likely to be hit by normal noise. Many traders set stops at a multiple of ATR and size positions so that the stop equals a fixed share of their account.
Bollinger Bands: squeeze then expand
When the bands narrow, volatility is compressed; scalpers watch for a break out of the squeeze with rising volume. Inside a wide, flat range, the outer bands act as zones where moves tend to stall.
Volume profile: the levels that matter
Volume profile shows how much traded at each price rather than each time. High-volume levels often act as magnets or support and resistance; thin areas tend to be crossed quickly. TradingView lists volume profile tools on its paid plans.
Two-indicator setups for the free plan
| Setup | Indicators | Best for |
|---|---|---|
| Trend and timing | VWAP + RSI | Stocks and index futures during the main session |
| Pure trend | One EMA script showing 9 and 21 + ATR | Crypto and forex, 24-hour markets |
| Breakout | Bollinger Bands + RSI | Range-to-breakout moves |
Tip: a single public script that plots several EMAs counts as one indicator, which frees a slot. More free-plan tricks are in our free plan guide.
When the free plan gets in the way
Scalpers usually outgrow the free plan fastest, for three reasons: two indicators is tight once you add VWAP, EMAs and RSI; one chart per tab means you cannot watch the 1-minute and 5-minute side by side; and three alerts is not enough for several levels. Essential (5 indicators, 2 charts, 20 alerts) solves most of it; Plus (10 indicators, 4 charts, 100 alerts) suits a full multi-timeframe scalping screen. Compare them in our plan guide, or let the plan picker choose.
A word on risk
Scalping means many trades, small targets and costs that add up quickly. Test any setup in Bar Replay or on a demo account before using real money, track your results honestly, and never risk more than you can afford to lose.
Last checked: October 2026.